The Great Housing Divide: 5 Surprising Realities of the 2026 Spring Market
1. Introduction: The Spring Market Paradox
The 2026 spring homebuying season has arrived with a distinct sense of irony. Traditionally, this window is defined by a feverish rush of buyers and a flood of fresh lawns on the market. Instead, we find ourselves navigating a complex paradox: mortgage rates remain stubborn at 6.61%, yet national median home prices have climbed to $417,700.
For the modern buyer, the market is no longer a monolith. It is a puzzle of regional shifts, strategic "upfront" pricing, and historical interest rate "handcuffs" that are creating a unique economic paralysis. Even as inventory creeps upward, the entry-level buyer remains increasingly priced out of a market that headlines claim is "correcting."
2. The Tale of Two Markets: Regional Fragmentation
One of the most striking features of the current landscape is its deep fragmentation. National averages currently obscure a heavy regional bifurcation. While the broader U.S. market is undergoing a structural shift, your reality depends entirely on your zip code.
The South and West are leading a transition into buyer-favorable territory, characterized by softer pricing and surging inventory levels. In sharp contrast, the Northeast and Midwest remain trapped in a hyper-competitive state, acting as localized seller counterweights to the broader national cooling trend. This regional split is critical; while national news might suggest a cooling market, buyers in the Northeast are still facing an uphill battle.
Bottom Line: South and West shifting to buyer favorable markets while the Northeast and Midwest remains highly competitive due to low inventory.
3. The "Golden Handcuffs" Effect: Why Nobody is Moving
The primary engine behind persistent inventory scarcity is a phenomenon of voluntary gridlock known as the "lock-in" effect. With the 30-year fixed mortgage rate sitting at 6.61%, a vast majority of existing homeowners are financially disincentivized to sell.
The data reveals the depth of these "golden handcuffs": 79% of outstanding mortgages are below 6%, 69% are below 5%, and a staggering 51% are below 4%. For more than half of American homeowners, moving means trading a sub-4% rate for 6.61%, a move that effectively removes them from the supply-side equation for the next decade. This creates a "low inventory trap" where potential sellers stay put to preserve their monthly payments, choking the supply of move-up homes.
4. The End of "Testing the Market": A New Pricing Strategy
A significant shift in seller behavior has emerged this year, labeled the "Upfront Pricing Strategy." In 2025, sellers often "tested the market" with inflated listing prices, leading to an erratic environment of dramatic price cuts. In 2026, the market is proving more stable.
Sellers are listing closer to true market value from day one. National data shows that while inventory is up, the percentage of properties requiring price cuts has actually dropped from 17.9% last year to 16.7%. This realignment is a response to buyer behavior; with the Average Days on Market (DOM) increasing from 50 to 52 days year-over-year, sellers recognize that buyers are taking more time to evaluate options and will simply ignore an overpriced home.
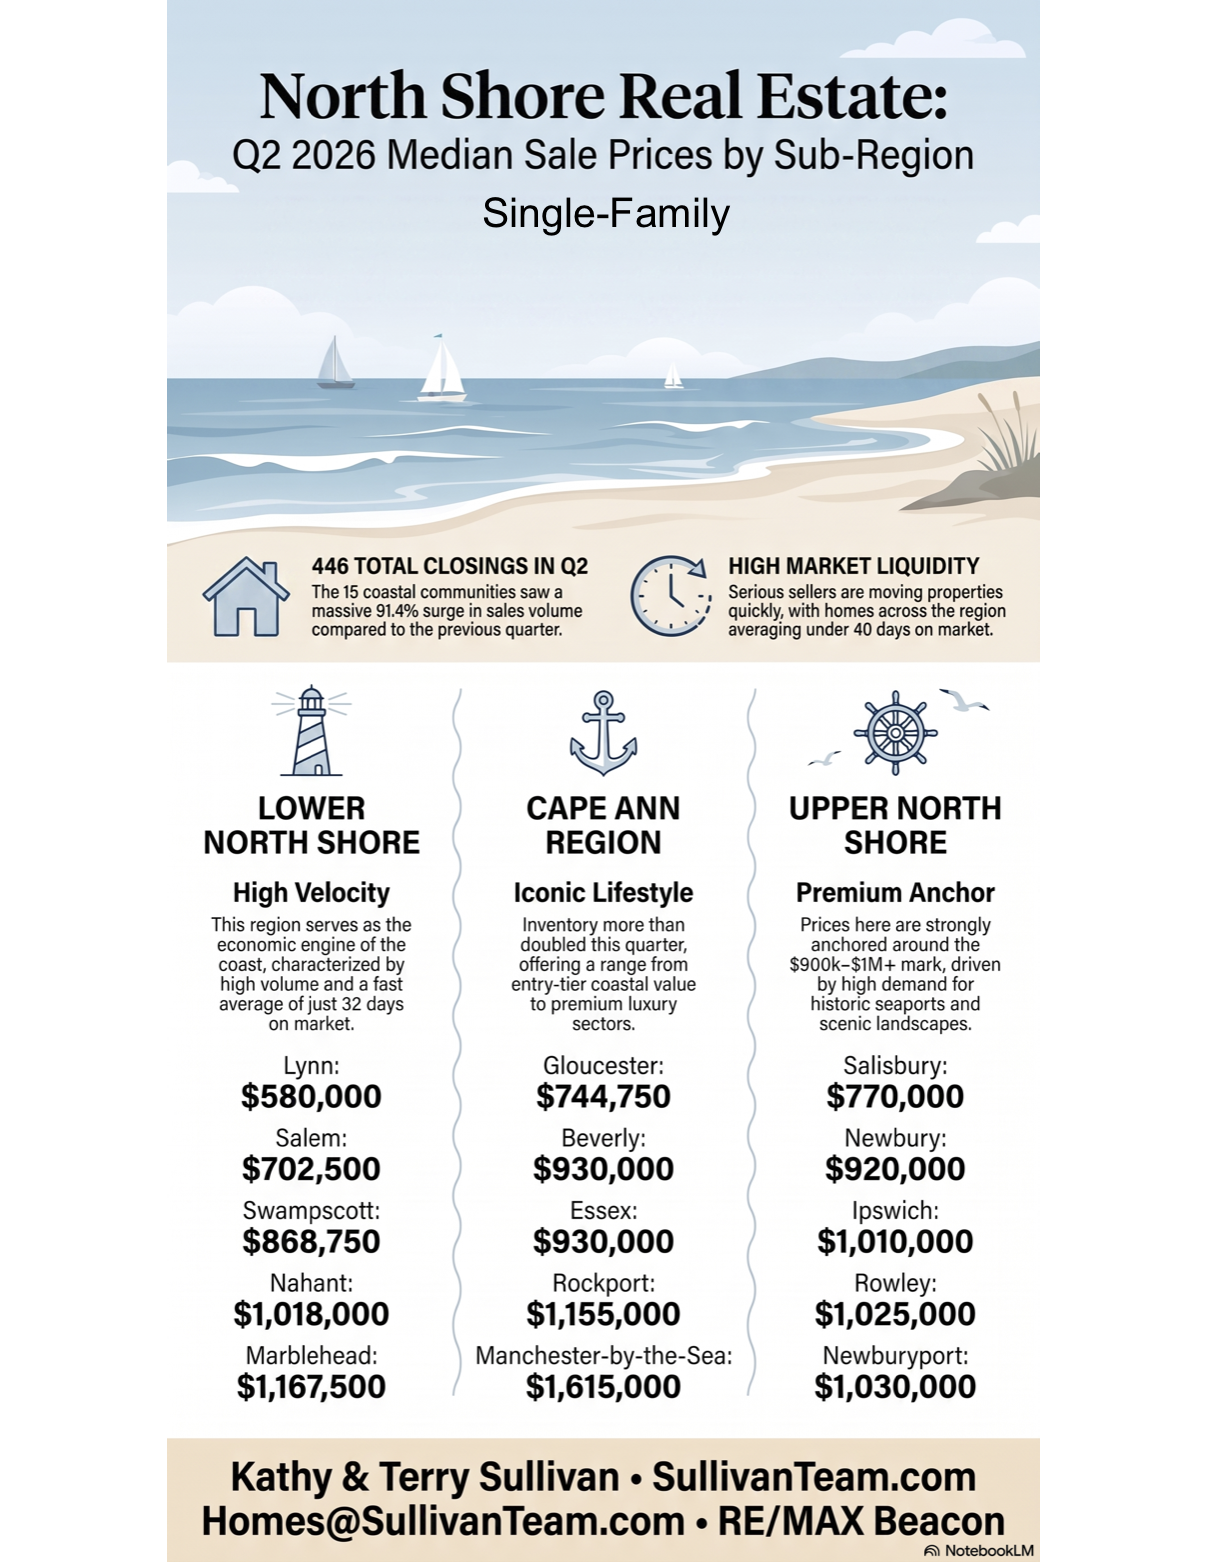
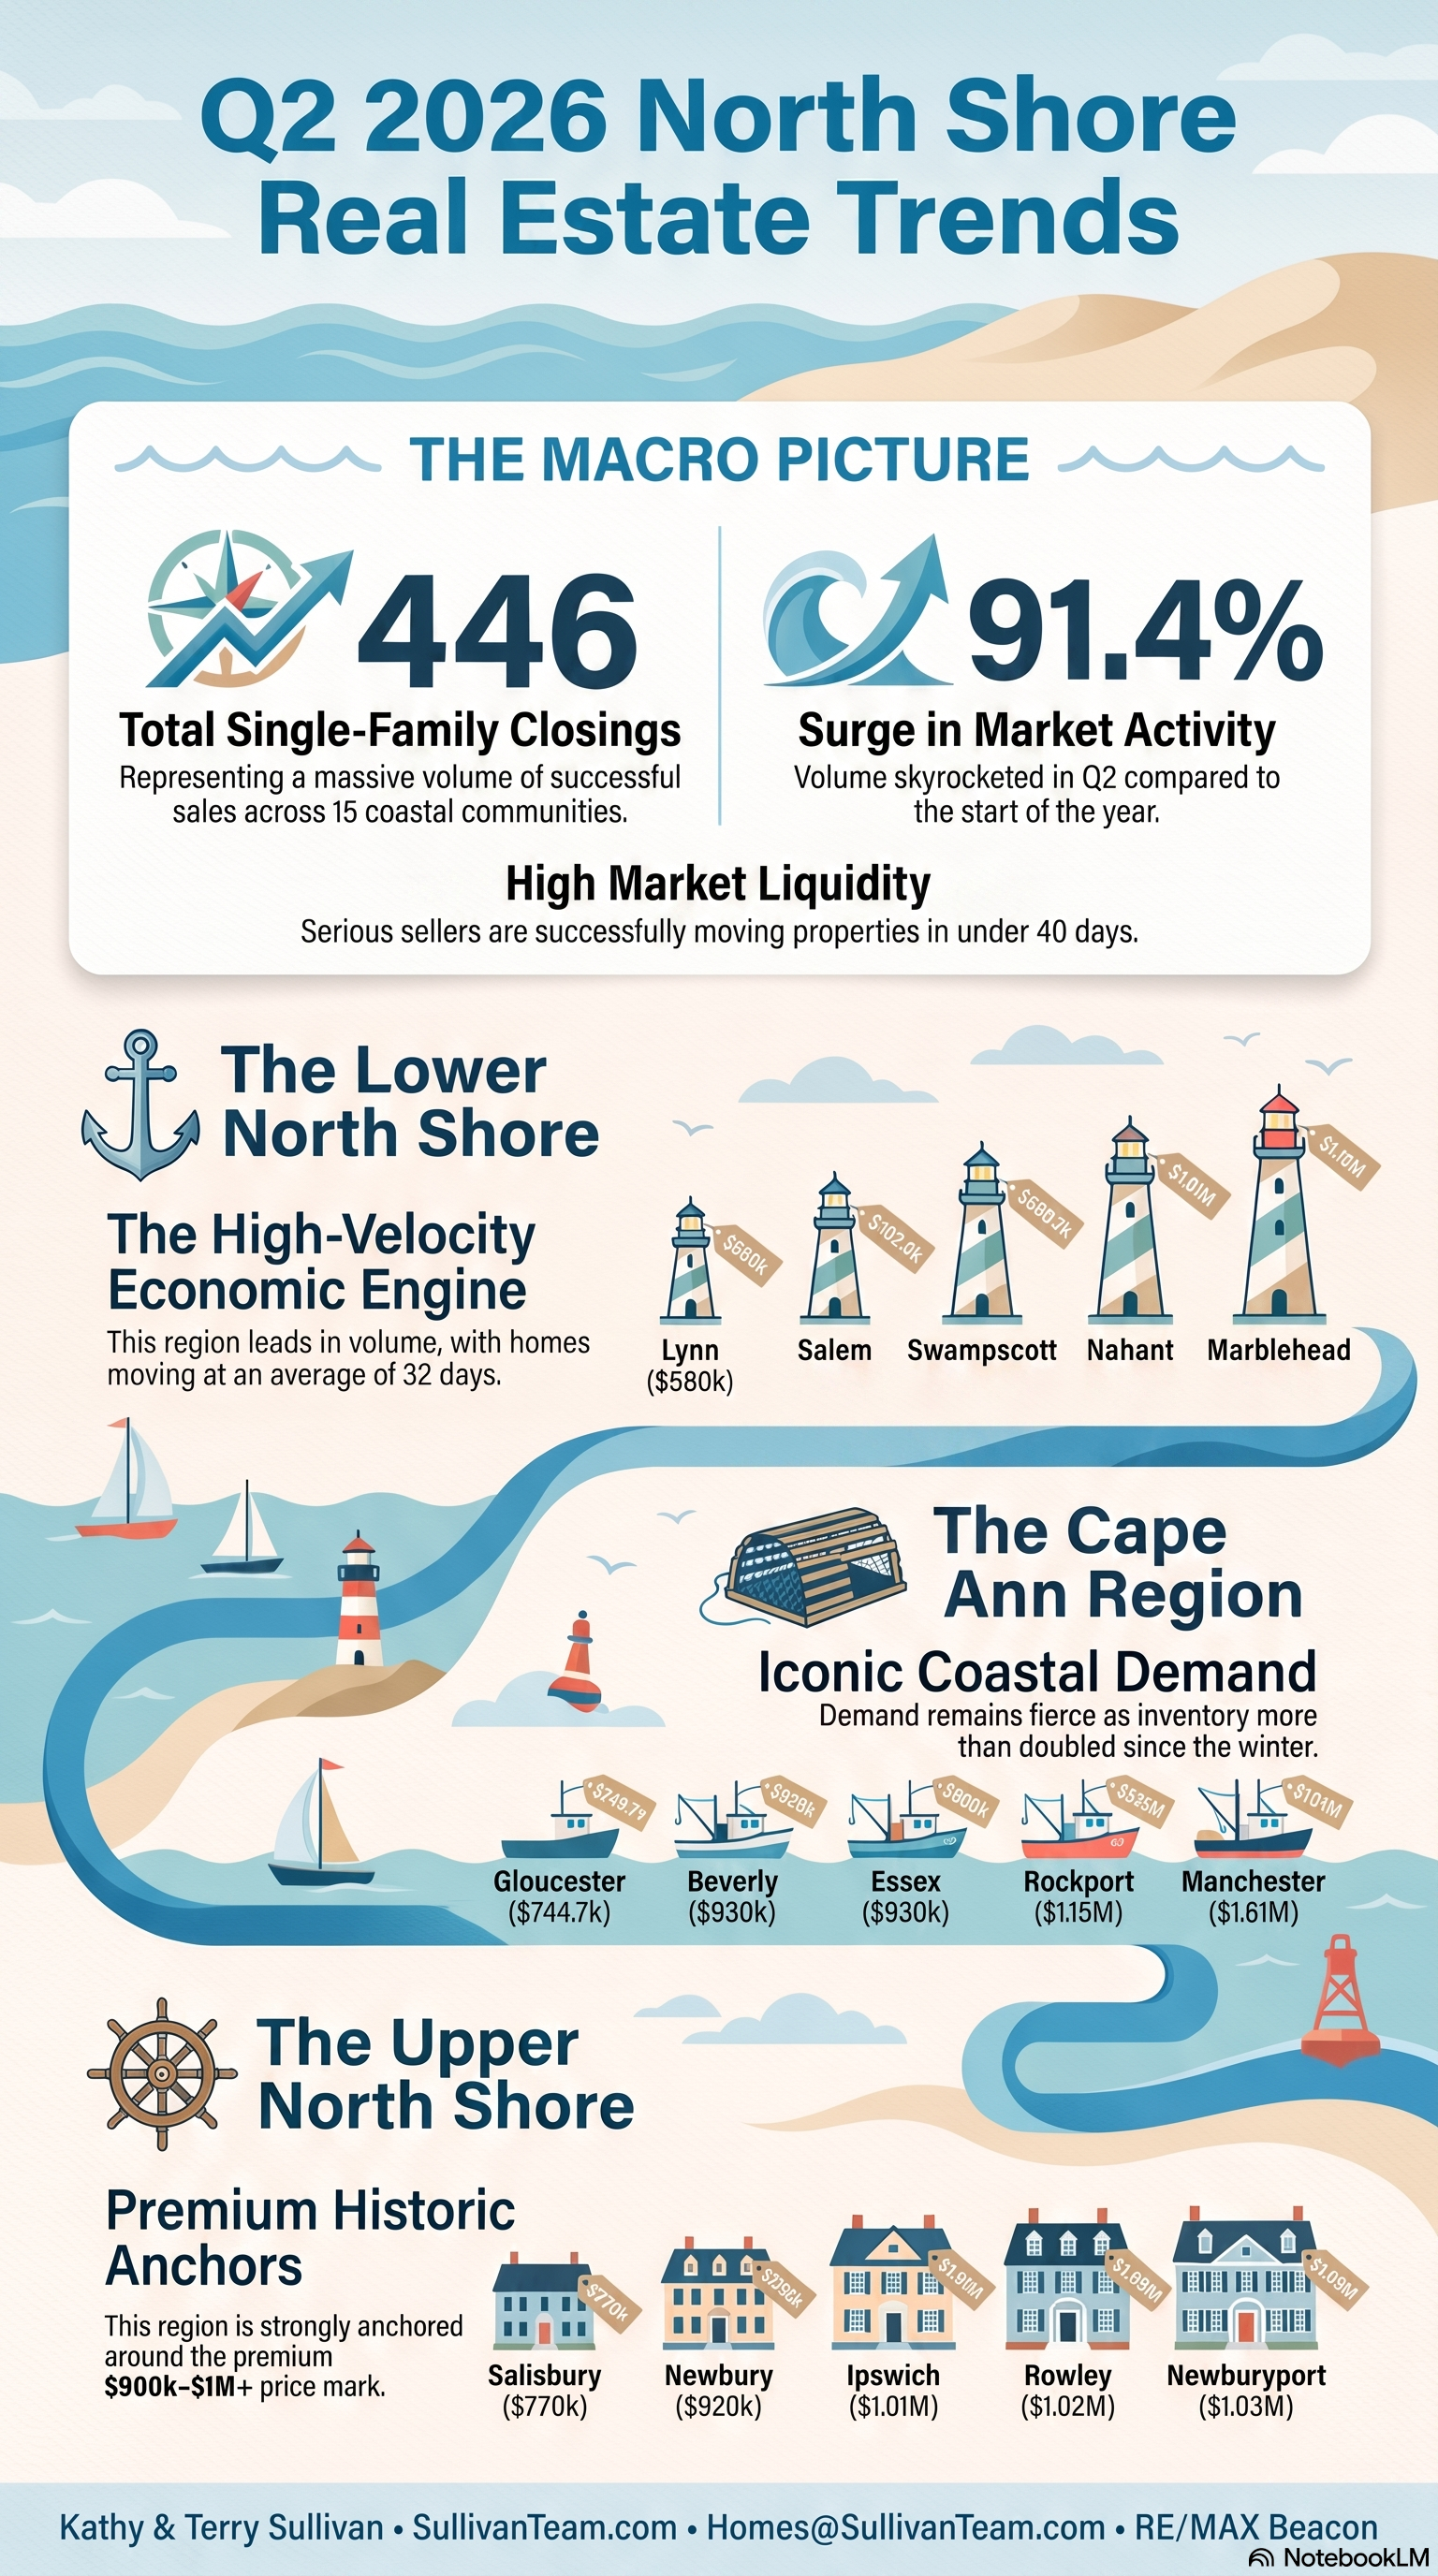
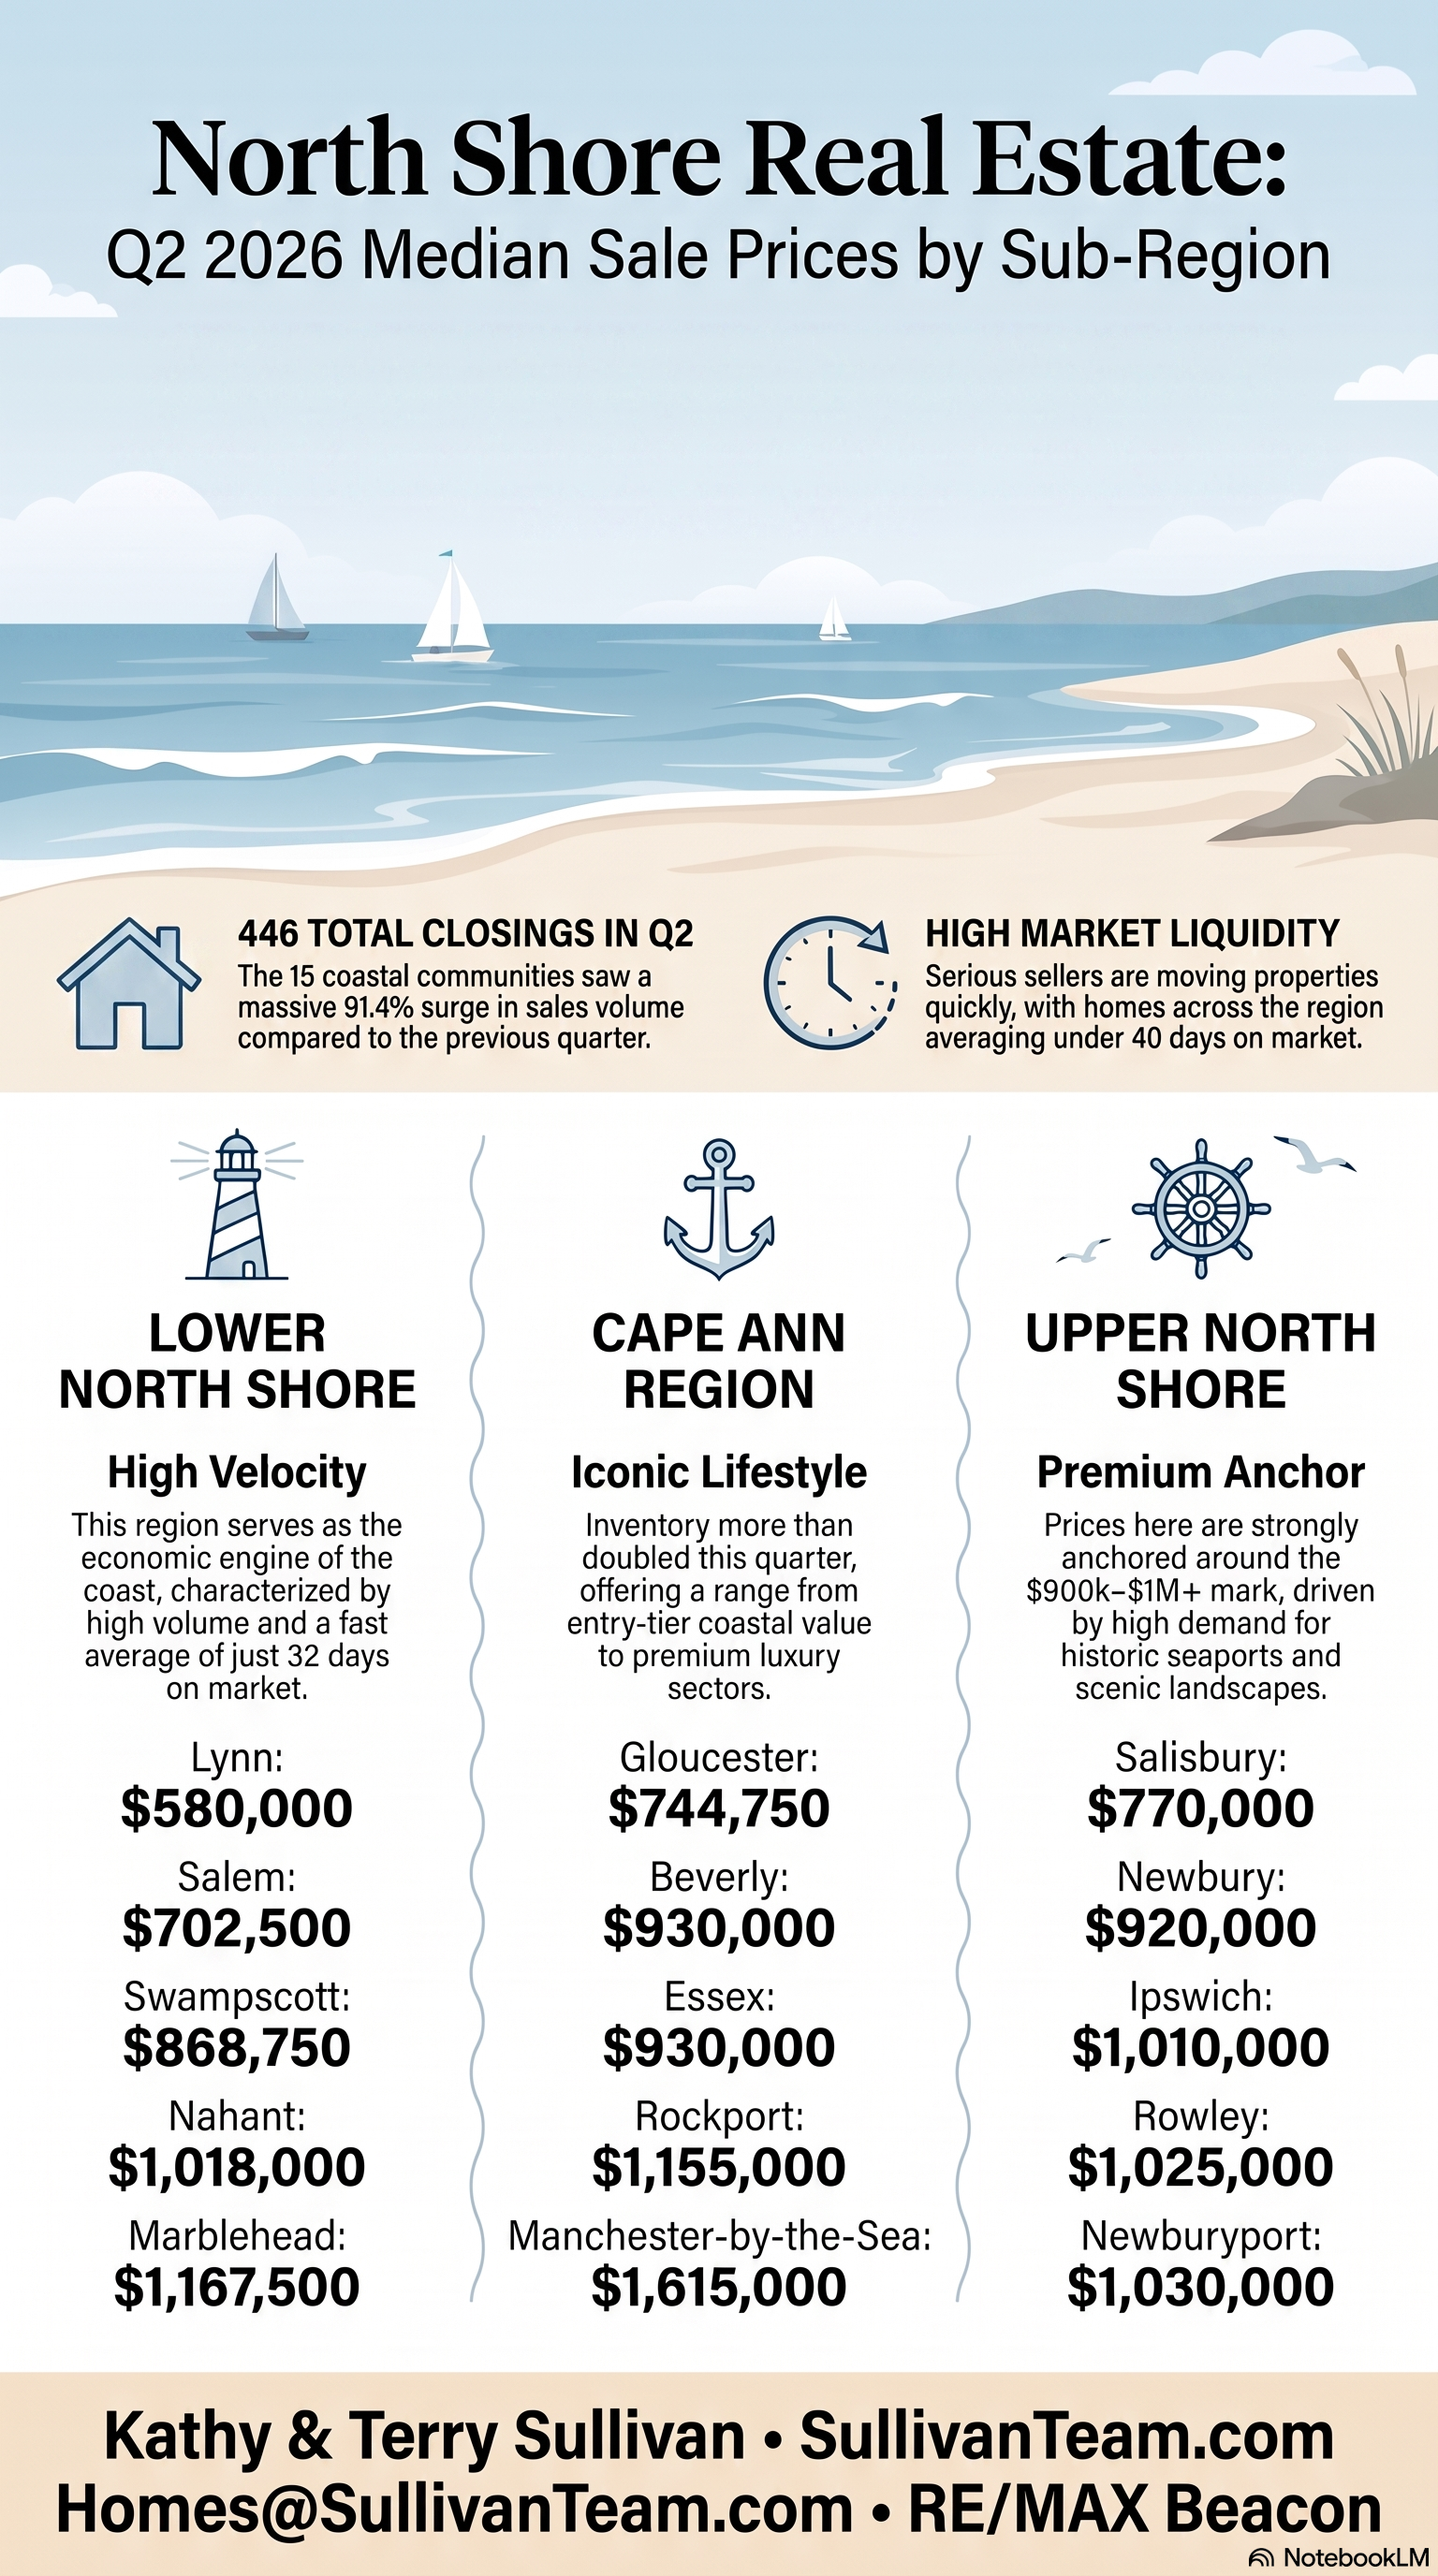
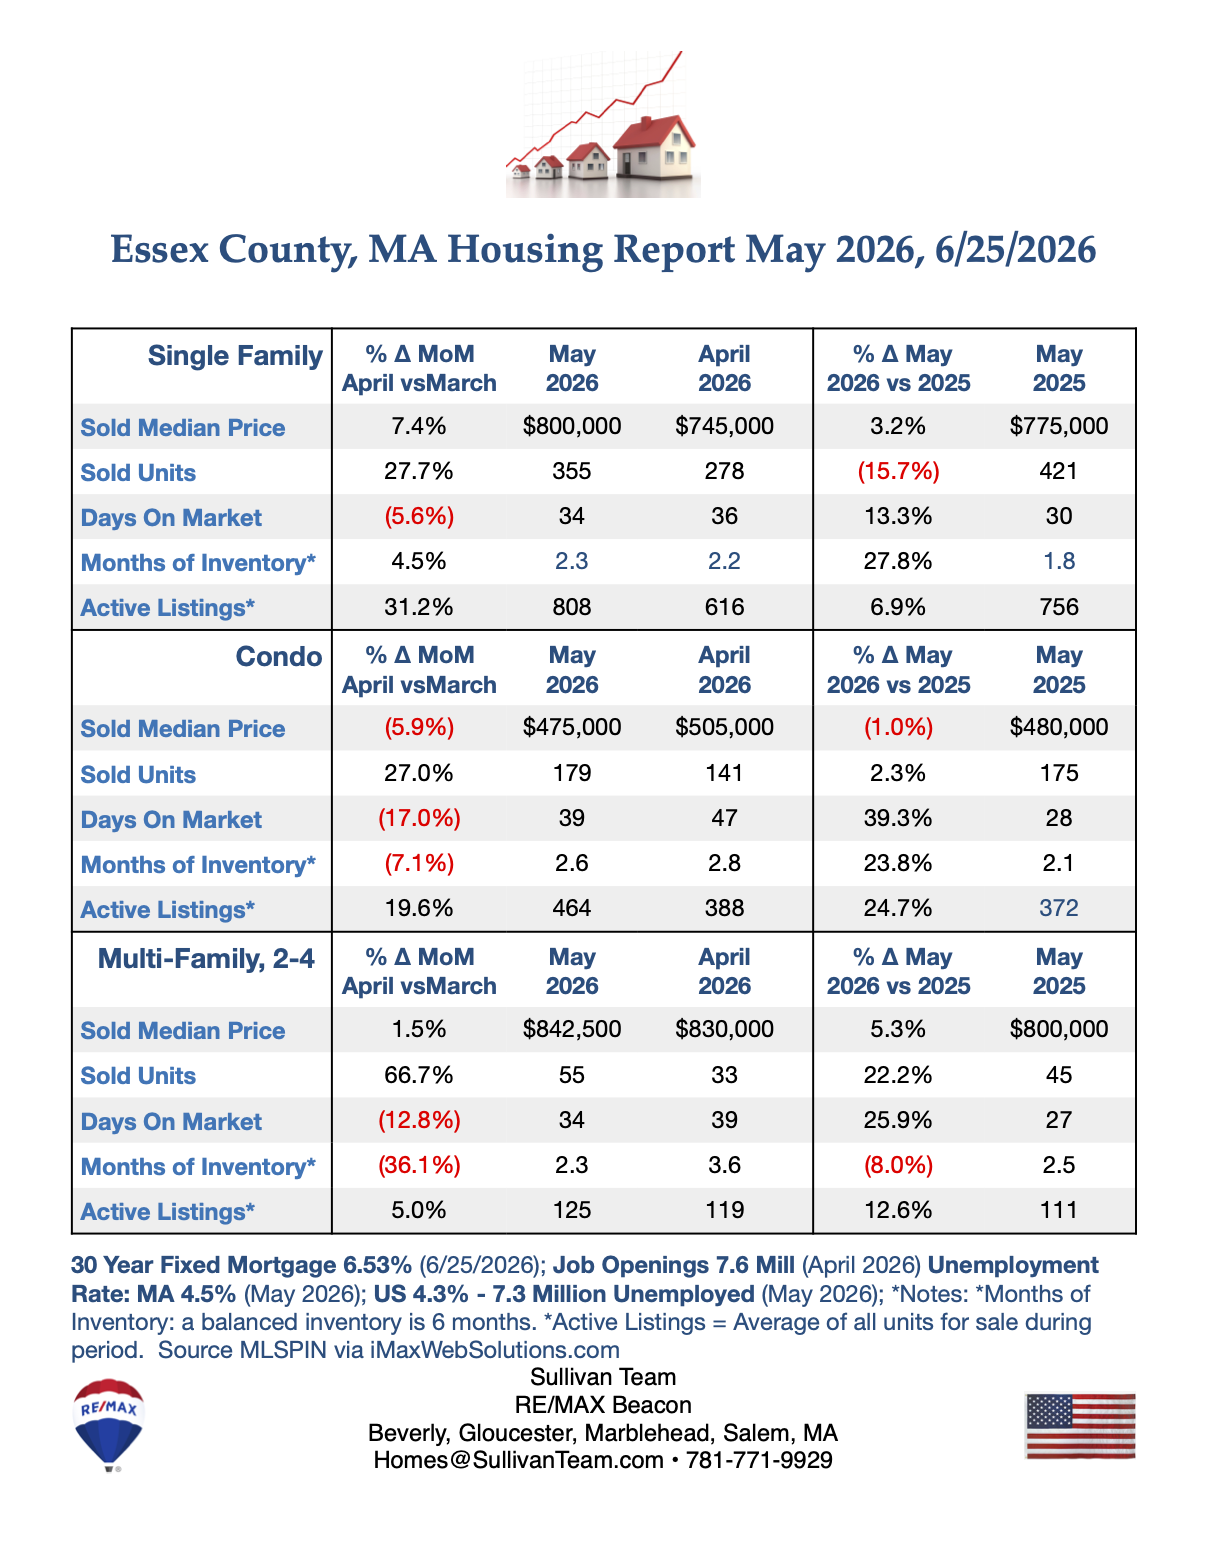
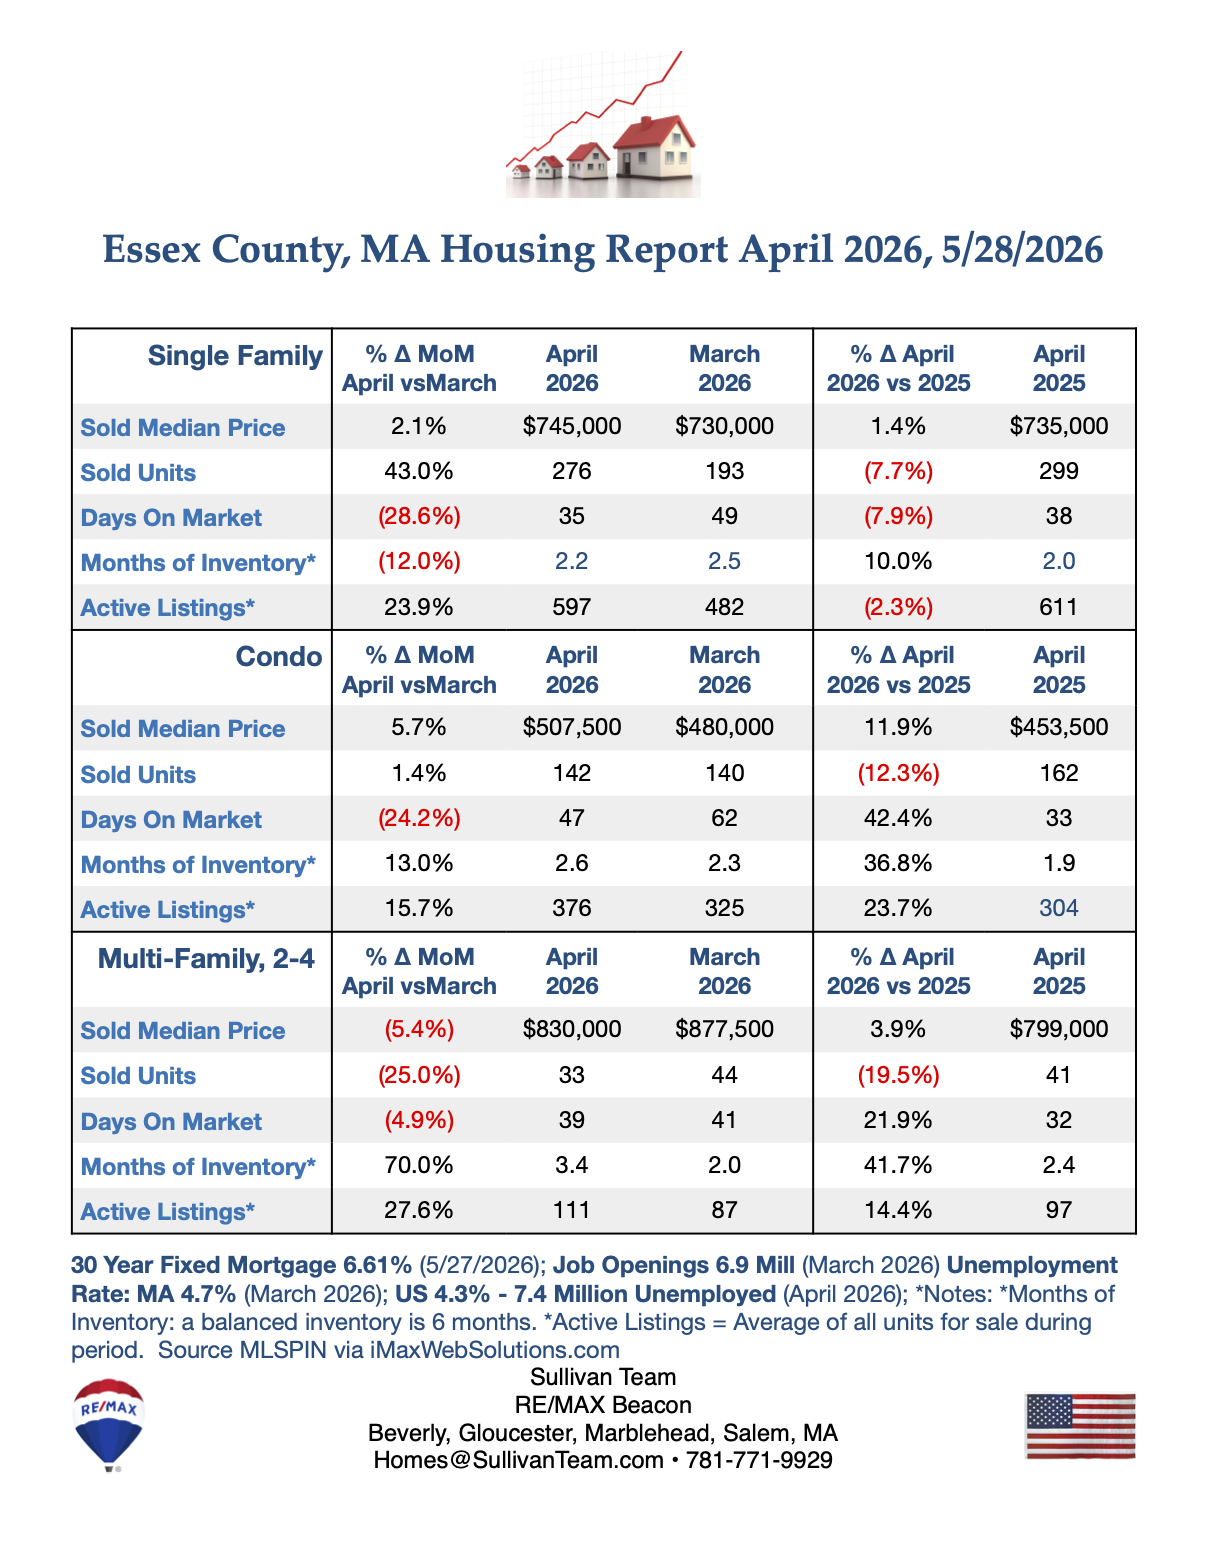
5. The Essex County Surge: Local vs. National Dynamics
While the national market edges toward balance, Essex County, MA, is witnessing a "Spring Rally" that defies national cooling trends. Single-family unit sales saw a massive 43% jump month-over-month in April. The local premium remains heavy: the median price for a single-family home reached $745,000, and condos hit $507,500—dwarfing the national median of $417,700.
However, the "Fragmented Market" thesis is visible even here. In Essex County, 21.3% of single-family listings and 30.3% of condos required price reductions—significantly higher than the 16.7% national average. Furthermore, the multi-family sector (2-4 units) is the only segment experiencing a true contraction, with a 25% drop in units sold and a 5.4% dip in median price (falling from $877,500 to $830,000). For investors, this sector represents a rare pocket of softening in an otherwise heated region.
6. The Million-Home Milestone: Inventory is Creeping Back
For the first time in recent years, national active listings have passed a major psychological milestone, reaching 1,002,935 properties. This expansion has pushed national supply to 4.4 months of inventory, up from 4.3 months in April 2025.
While this is a sign of a healthier market, it is not yet a "balanced" one. Traditional real estate metrics define a balanced market at 6 months of supply. At 4.4 months, the market still firmly favors the seller. This creeping growth suggests a healthy correction is underway, but the extreme "bidding war" era has only moderated, not ended—especially in the inventory-starved Northeast.
7. Conclusion: The Road Ahead
The 2026 market is a study in transition. Nationally, we see a move toward stability as inventory hits the one-million mark and sellers adopt more realistic pricing. Locally, however, inventory remains the ultimate kingmaker, keeping prices high and competition stiff in regions like the Northeast and Midwest.
As we look toward the second half of the year, a pivotal question remains: Is the "new normal" of 6%+ mortgage rates finally being accepted as the permanent baseline, or is the current expansion of inventory the first sign that a true, buyer-friendly correction is just beginning?