Planning Your 2026 Real Estate Moves: A Guide to the Best Buying and Selling Seasons
Timing isn’t everything in real estate, but it can mean the difference between saving $20,000 or paying a premium, selling in 30 days or waiting three months, and negotiating from a position of strength or uncertainty.
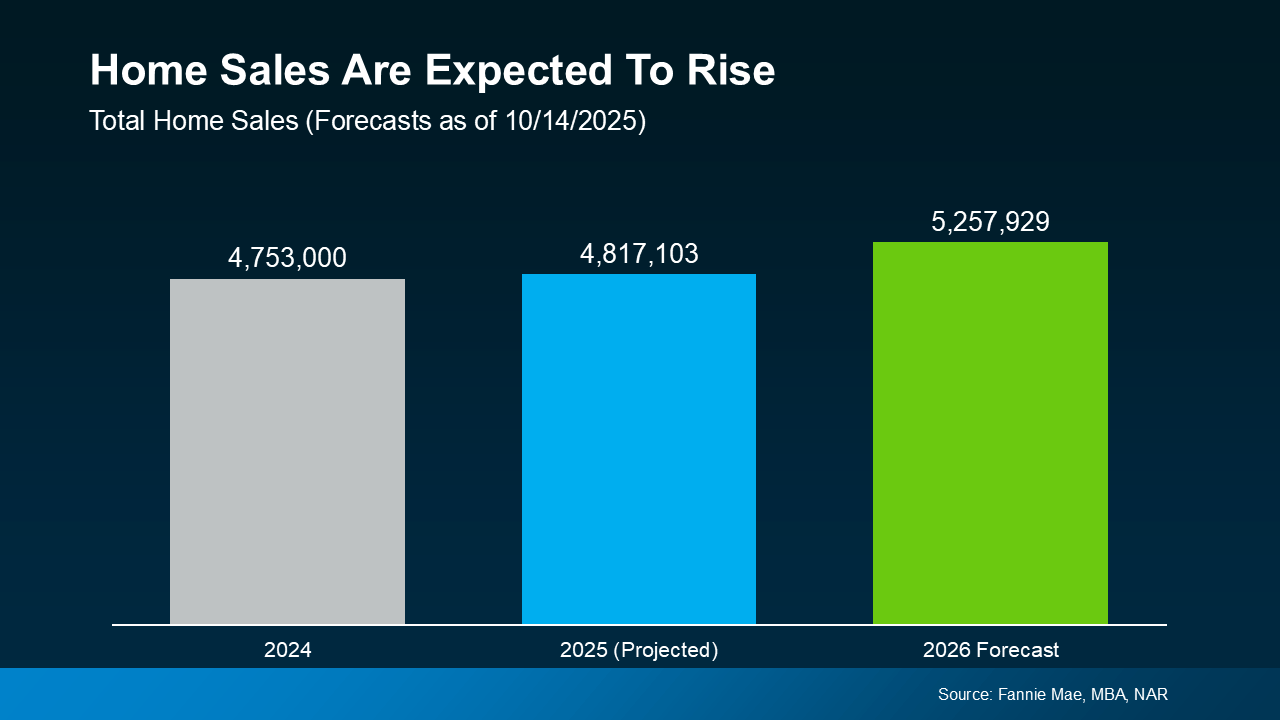
As we look toward 2026, understanding seasonal patterns has become more critical than ever. With inventory levels normalizing and market conditions continuing to evolve, knowing when to make your move can dramatically impact your outcome. Whether you're a first-time buyer watching every dollar or a seller trying to maximize your profit, the season you choose matters.
The challenge? Not everyone can wait for the "perfect" time. Job relocations happen in January. A growing family needs more space in July. Retirement doesn’t wait for spring. This guide breaks down the pros and cons of each season so you can make the smartest decision within your timeline.
Spring: Peak Selling Season (March-May)
Spring isn’t called peak season by accident. The housing market comes alive with energy that is impossible to ignore. Data shows homes listed in spring sell in as few as 33 days, compared to 49 days in winter.1 May also offers the highest seller premium, 13.1% above market value, translating to faster sales and higher returns.2
Buyer psychology also plays a role. Warmer weather encourages open house attendance, longer daylight allows more viewings, and families aim to move before school starts, creating urgency. Spring blooms and greenery boost curb appeal in ways winter staging cannot match.3
The Competition Factor
The trade-off is that spring’s advantages come with more competition. Sellers must make their homes stand out, pricing correctly, staging well, and marketing aggressively. Buyers benefit from the largest inventory, with new properties listed weekly, but face higher competition. In May and June, 35% of buyers pay above list price compared to 24% in January, making bidding wars common and increasing pressure to decide quickly.4
Summer: Extended Peak Season (June-August)
As spring transitions to summer, the market maintains its momentum. June often sees the highest sales volume of the year, with more than 16,500 homes selling per day.1
The Family Timeline
Summer’s appeal aligns with family schedules, as school breaks let children move without disrupting education. Warm weather and long days make moving easier and provide ample time for viewings. Outdoor spaces like pools, patios, and landscaping are at their best. Higher prices and sales activity reflect the premium buyers pay for peak-season convenience.
Late Summer Shifts
By August, changes appear. Unsold spring or early summer listings may become “stale,” and buyers begin settling as school starts. Competition eases slightly, though prices stay high, making it a transition month where patient buyers can benefit.
A practical concern is moving costs, which peak in summer due to high demand. Nearly half of all household moves occur between June and August, increasing competition for movers and rental trucks alike.5
Fall: Underrated Opportunity Season (September-November)
Fall might be real estate's best-kept secret. While conventional wisdom suggests spring is the only time to transact, savvy buyers and sellers increasingly recognize fall's unique advantages.
Less Competition, More Serious Players
Data shows a large share of home sales occur in the fall, a detail often overlooked. With fewer competing sellers, listings stand out more, and active buyers tend to be serious and ready to act quickly.3
October typically offers the best conditions for buyers. Data shows it has one of the lowest seller premiums of the year—about 8.8% above market value—as demand cools and competition eases.2 Home prices also tend to dip slightly from summer highs, saving buyers thousands compared to peak-season purchases.4 For first-time buyers especially, fall can be an ideal time to find value without the bidding wars of spring and summer.
The Urgency Factor
Fall brings natural urgency. Buyers aim to close before holidays and bad weather, while sellers may be motivated by taxes or avoiding a winter listing. Comfortable weather in many areas makes showings easier.
Fall buyers are often more decisive, with fewer casual browsers and more serious purchasers ready to negotiate.
Winter: Value Season (December-February)
Winter gets a bad reputation in real estate, but for buyers with flexibility, it offers the year's best value proposition.
The Numbers Don’t Lie
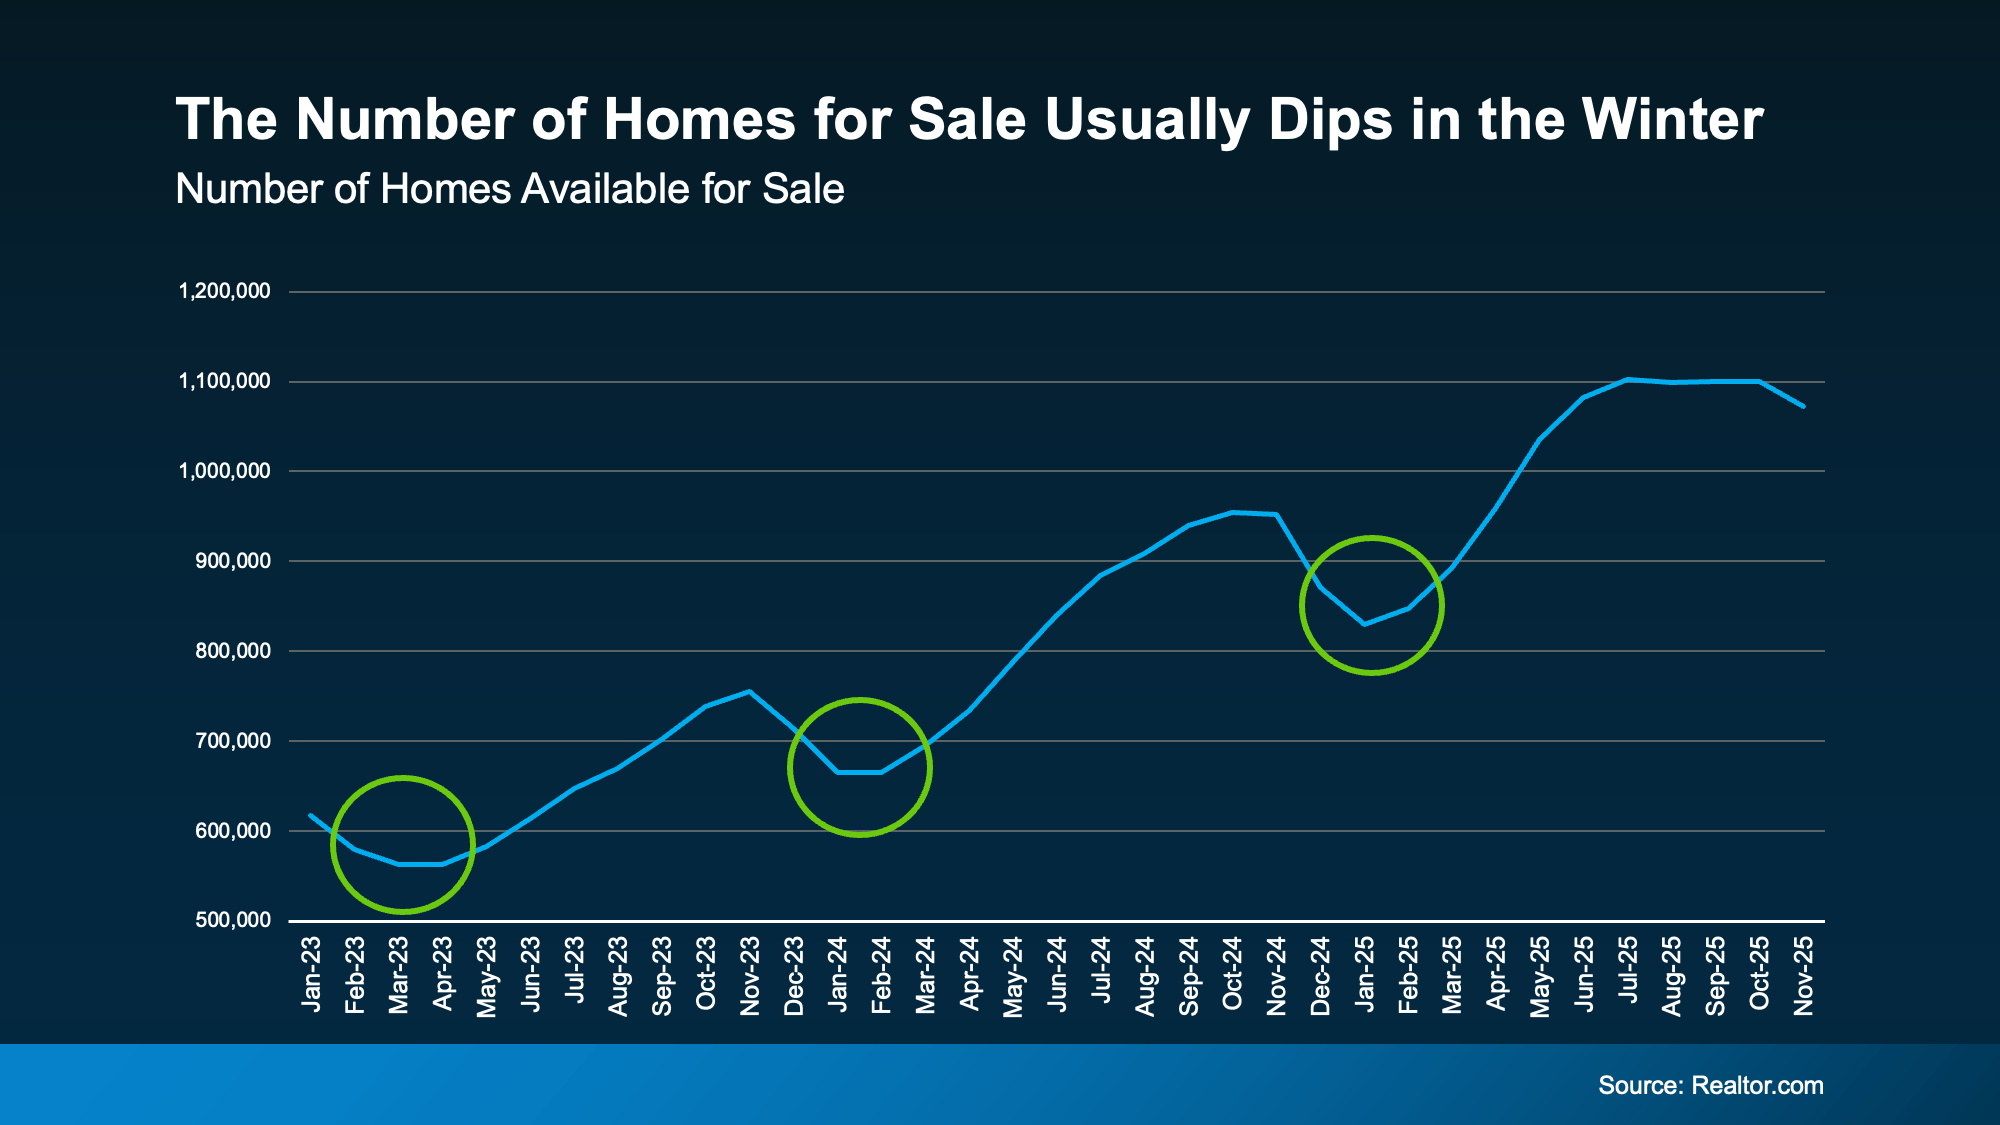
The low-competition environment in winter provides the best opportunity for buyers to secure a discount. In January, only 24% of buyers pay above list price compared to 35% in May and June, which greatly reduces the chance of bidding wars.4 This lower competition also means winter homes stay on the market longer, averaging 49 days versus 31 days during peak season, giving buyers more time, less pressure, and stronger negotiating power.1 Motivated sellers become more flexible as the holidays pass. Moving companies also offer their lowest rates in winter.
Winter’s Challenges
Winter has trade-offs. Sellers face the lowest buyer traffic, holiday distractions, limited curb appeal from dormant landscaping, and shorter daylight for showings.
Yet winter offers advantages. Less competition can help if you price aggressively and present well, and buyers who do visit are highly motivated, often relocating for jobs. Warm-climate markets like Florida and Arizona see smaller winter slowdowns, making location important.1
Snow and ice create safety hazards, and cold weather makes moving harder. However, winter also reveals property truths, such as heating efficiency, drafty windows, and roof performance, which is all information savvy buyers use during inspections.
Regional Differences: Not All Markets Are Equal
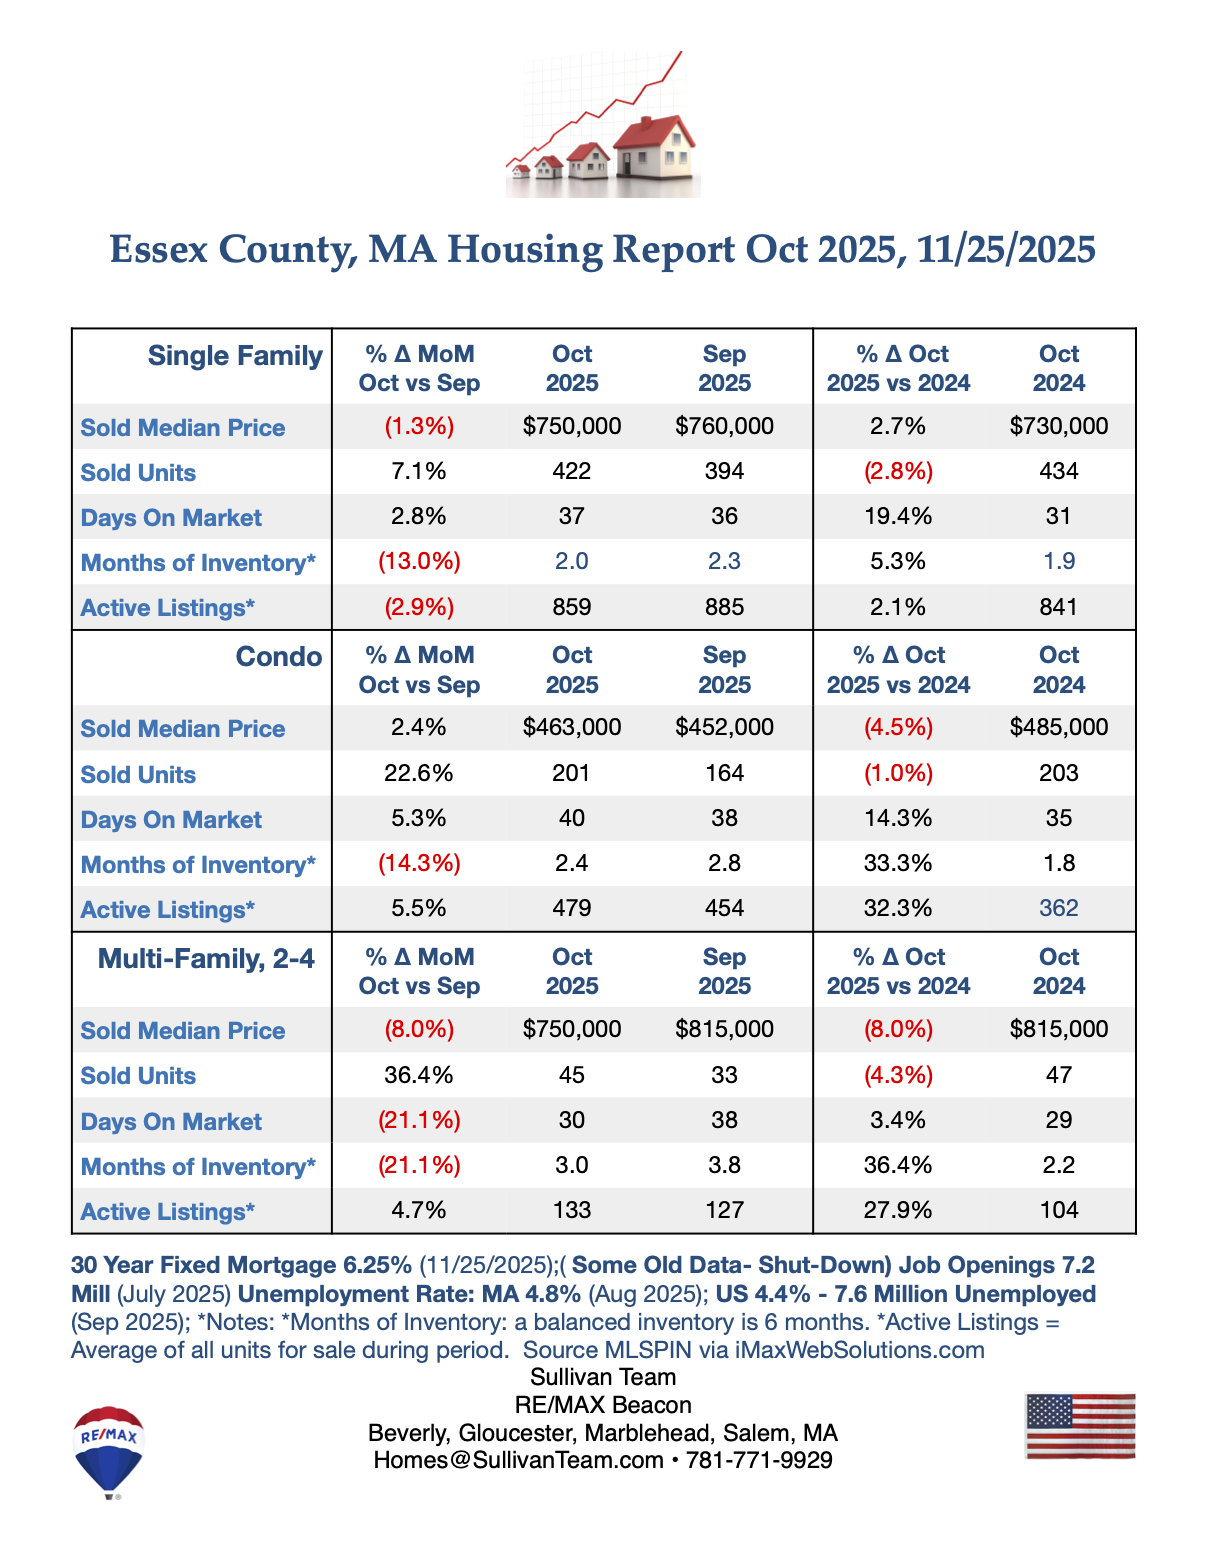
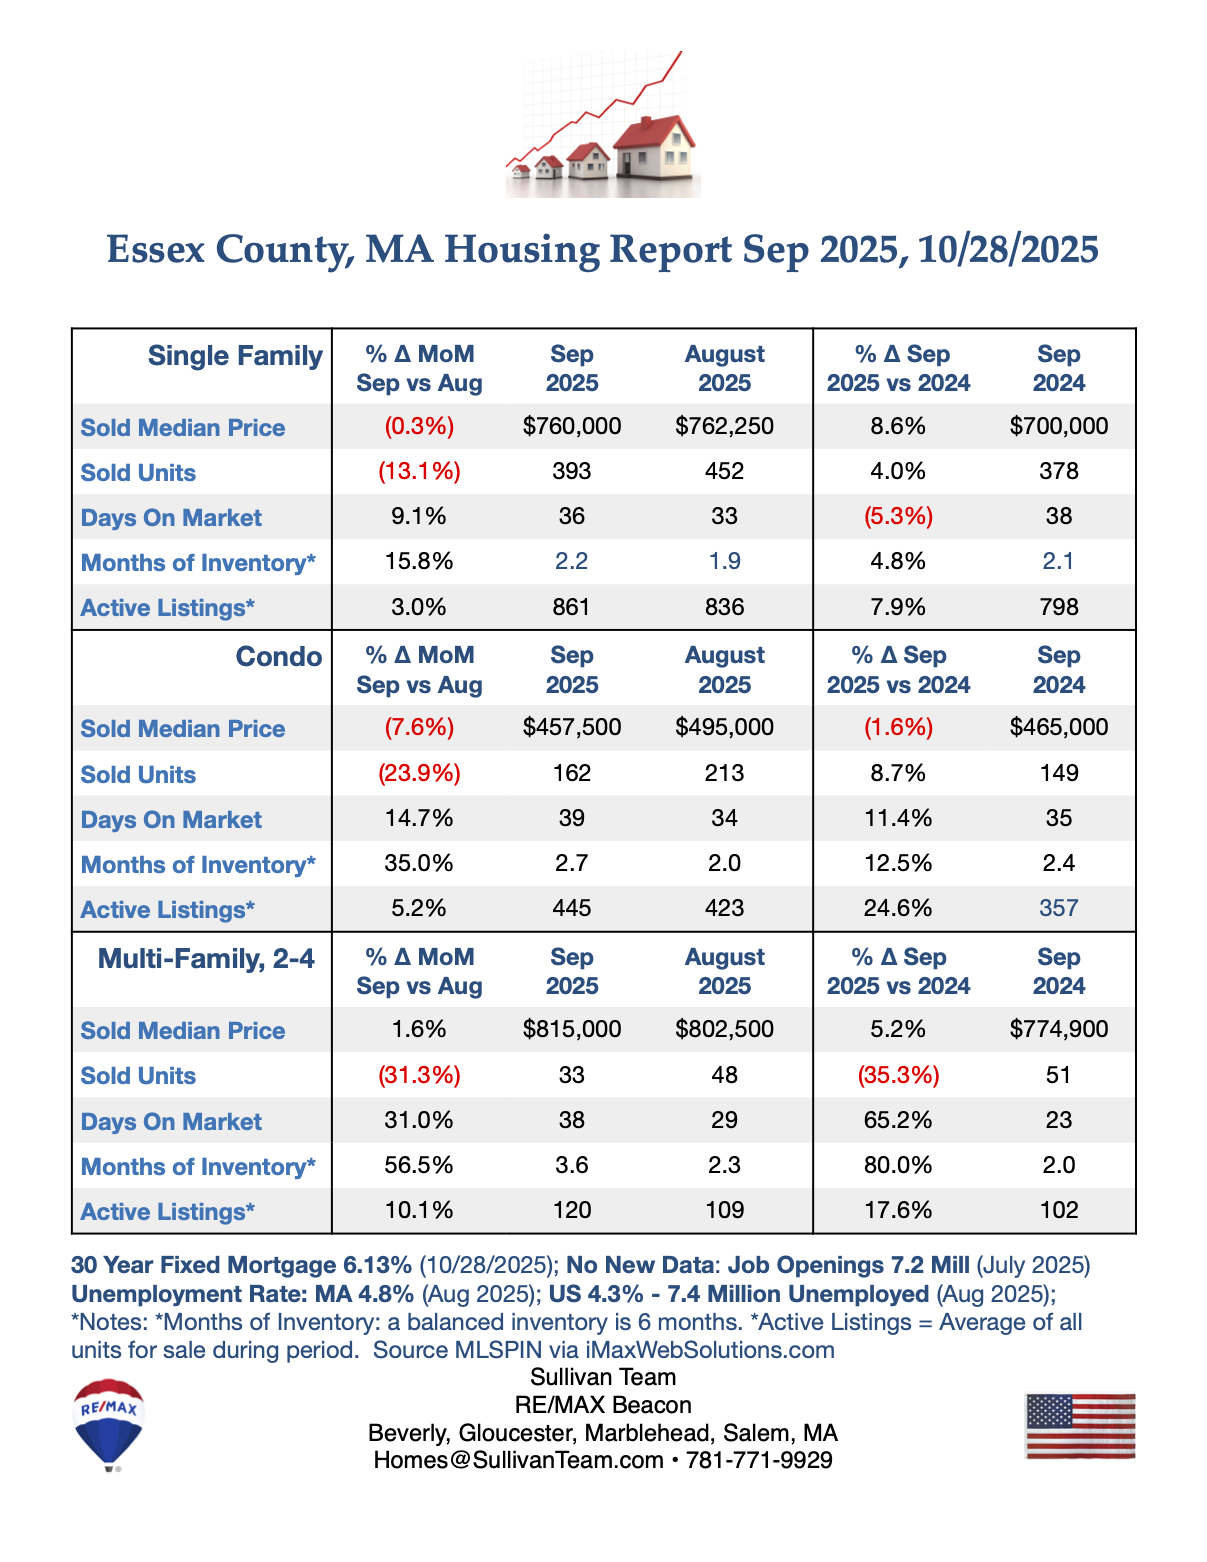
Seasonal changes in the real estate market depend heavily on location, meaning a strategy that works in one city may fail in another. Markets in the Midwest and Northeast experience the most dramatic seasonal swings due to harsh winters, which push most activity into the short window between May and August. For example, daily home sales in the Midwest often more than double from January to June, with states like Illinois and Ohio seeing significant annual price swings.
In contrast, Southern and Western markets enjoy stable, year-round activity because of mild weather. Places like California and most of the South see much less severe slowdowns in winter. The exception markets are those where mild winter weather attracts buyers, like Phoenix, Arizona, where the best selling time is late November. Understanding these local patterns is crucial, as local market dynamics always matter more than general national statistics. Feel free to reach out if you would like to know more about the specific seasonal patterns in your local area.
Pricing Strategies by Season
Pricing strategy must adapt to seasonal realities. What works in May fails in December, and vice versa.
Spring and Summer Pricing
During peak season, competitive pricing often attracts multiple offers. Pricing strategically 10–15% below comparable sales can spark competition and push final offers above list. Psychological pricing also matters; listing slightly under round numbers ($349,000 instead of $350,000) increases online visibility and appeals to buyer behavior. Emphasizing seasonal features such as outdoor spaces, natural light, and blooming gardens helps justify premium pricing.3
Fall Reality Check
As competition declines in fall, pricing should be more realistic. Listing slightly below spring comparables can help generate activity. Flexibility on price attracts serious year-end buyers eager to close before the holidays and bad weather. Recognizing buyer urgency allows you to price strategically rather than reactively.2
Winter Aggression
Winter requires more aggressive pricing to attract a smaller buyer pool. Pricing 5–10% below spring values can create immediate interest. Motivated sellers should focus on value over premium pricing. Buyers shopping in January aren’t bargain hunters, they’re seeking homes that justify moving during an inconvenient season.1
Year-round best practices stay consistent: use a Comparative Market Analysis, consider current market conditions, account for unique property features that algorithms may overlook, and monitor comparable sales while staying open to adjustments.
Buyer Offer Strategies by Season
Spring and Summer Competition
Peak season requires quick, confident action. Get pre-approved to show you’re a serious buyer and be ready to move fast. Consider offering above asking price when you find the right property, and use an escalation clause to outbid competitors up to your limit. Flexible closing dates also strengthen your offer. Some buyers write personal letters to create emotional connections.
Fall and Winter Leverage
Negotiating power shifts with the seasons. In fall and winter, when seller competition drops and buyer pools shrink, you gain leverage. You can more easily request seller concessions such as closing costs, home warranties, repairs, or even appliances and fixtures. Use inspection results to negotiate price reductions, as motivated sellers grow more flexible later in the season. You can also request longer inspection periods and winter move-in credits.¹
Year-Round Negotiation Fundamentals
No matter the season, understanding the seller’s motivation is key. Support your offer with market data rather than emotion, and build rapport when possible. Stay calm and avoid emotional decisions.
Have your agent handle offers and counteroffers to reduce tension. Know your limits and walk away from deals that don’t fit your goals. In buyer’s markets, be assertive; in seller’s markets, make offers strong and decisive. The fundamentals stay the same, though their intensity shifts with the season.
BOTTOMLINE
Seasonality creates opportunities and challenges, but personal circumstances should drive timing. Spring/early summer brings the highest prices and fastest sales. Winter offers buyers the best deals. Waiting for the “perfect” season doesn’t help if life demands action.
Understanding your specific situation, timeline, and goals allows us to create a customized strategy that maximizes outcomes within your constraints. The best time to move is when it's right for you.
Sources
1. National Association of REALTORS®. Navigating the Housing Market: A Seasonal Perspective. 2024.
https://www.nar.realtor/blogs/economists-outlook/navigating-the-housing-market-a-seasonal-perspective
2. Bankrate. Best Time to Sell a House. 2024
https://www.bankrate.com/real-estate/best-time-to-sell-house
3. Investopedia. How Seasons Impact Real Estate More Than You Think. 2024.
https://www.investopedia.com/articles/investing/010717/seasons-impact-real-estate-more-you-think.asp
4. Zillow
https://www.zillow.com/learn/best-time-to-buy-a-house/
My Moving Journey
https://mymovingjourney.com/blogs/moving-in-peak-season-vs-off-season
